- Lightroom Presets
- Best Sellers
- Mobile Presets
-
Photoshop
-
Learn
-
Support
-
Install
- Blog

The histogram is very helpful tool used by photographers to tell whether their photo has good exposure, and whether there are any lost details (clipped highlights or shadows) in their image.
The information in the histogram will help you decide whether you need to adjust your exposure and/or contrast.

You can see histograms displayed in most camera's that offer a manual mode (although you may need to turn this feature on) AND within Lightroom - located at the upper right hand side of both the Library and Develop modules.
In this tutorial, we will focus on the histogram in Lightroom!
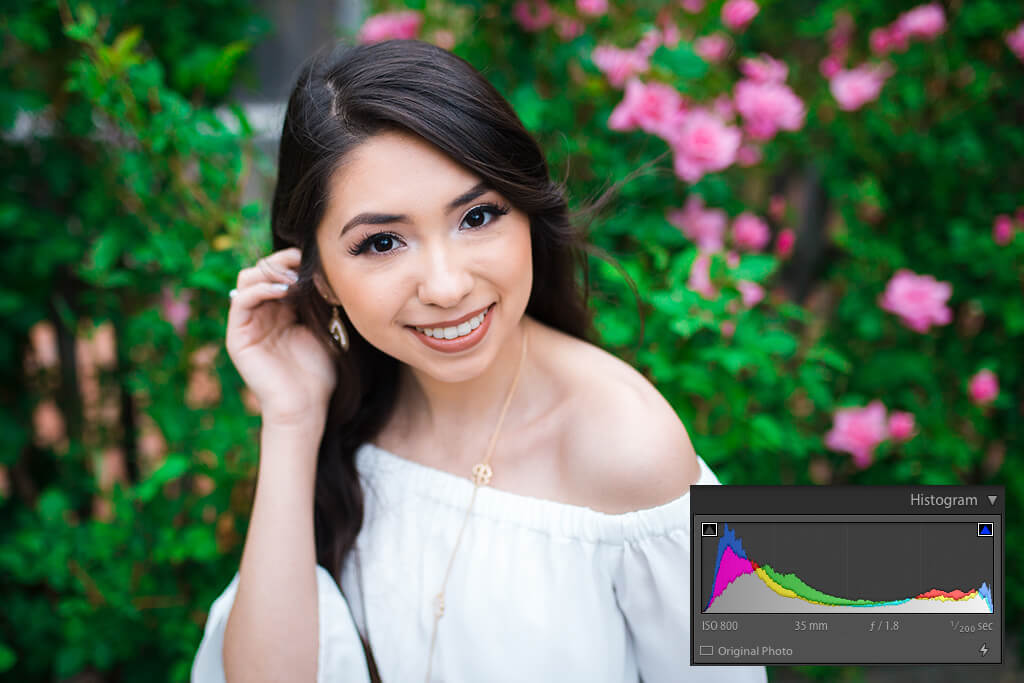
Simply defined, the histogram is just a graph of all the different tonal values located in your image.
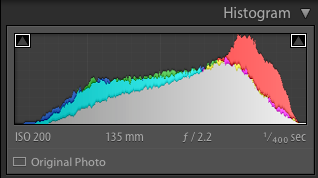
The more of a certain tone there is, the higher the histogram graph will get in that area.
There is no such thing as a perfect histogram! The dynamic range of tones in each individual photo will dictate what the histogram looks like.
For example:
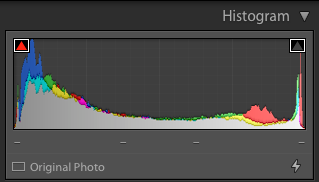
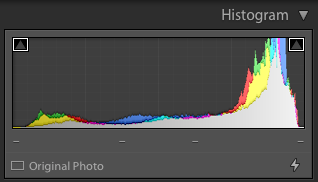
Photographer’s often talk about “clipping” the highlights or shadows. Or they sometimes refer to it as the highlights or shadows being “blown out.”
Simply put, this means is there is no photo information in those particular areas - THEY ARE PURE WHITE OR PURE BLACK.
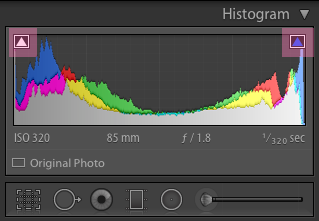
Histogram’s with clipped whites or clipped blacks will look similar to the images below:
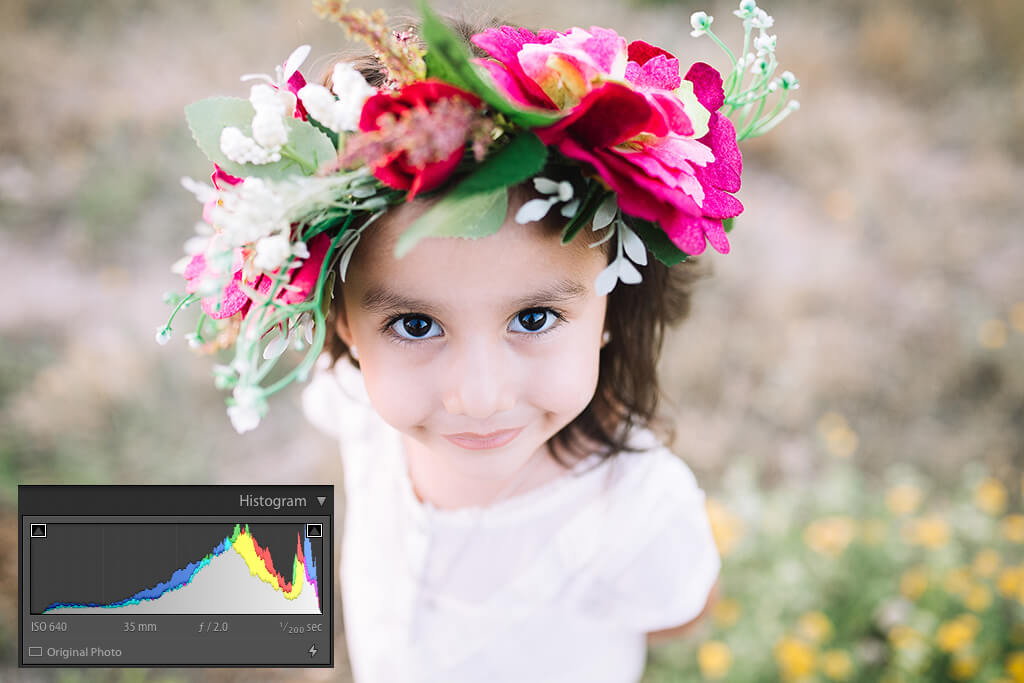
Looking at and understanding what the histogram is showing you will allow you to determine if you have successfully captured an evenly lit, dark or light image.
If that is not what you were trying to achieve, you now have the chance to make some adjustments.
No need to adjust your exposure in the Basic Panel. You can just click and drag directly on the histogram in Lightroom. Adjustments you make there will move and show in the sliders within the Basic Panel.
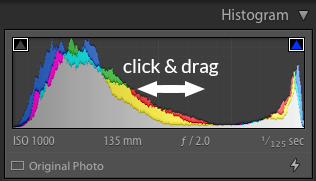
As you hover your cursor over the histogram, the affected area will be highlighted and the name of the slider you will be adjusting will appear on the left side directly below the histogram. When you click and drag, the amount you are adjusting that particular slider will appear on the right side directly below the histogram.

To see any "clipped" values in your photo, hover over the small triangles in the upper right and upper left of the histogram. You can also press Lightroom keyboard shortcut "J" to toggle on or off seeing those clipped areas.
Hovering over areas of your photo will display the RGB color values directly below the histogram. You can see these values change as you move the cursor around your photo.
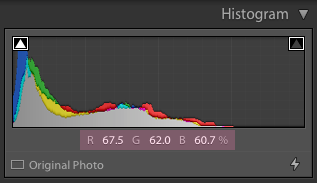
This can also be used to see "clipped" values as well (0% is black and 100% is white).
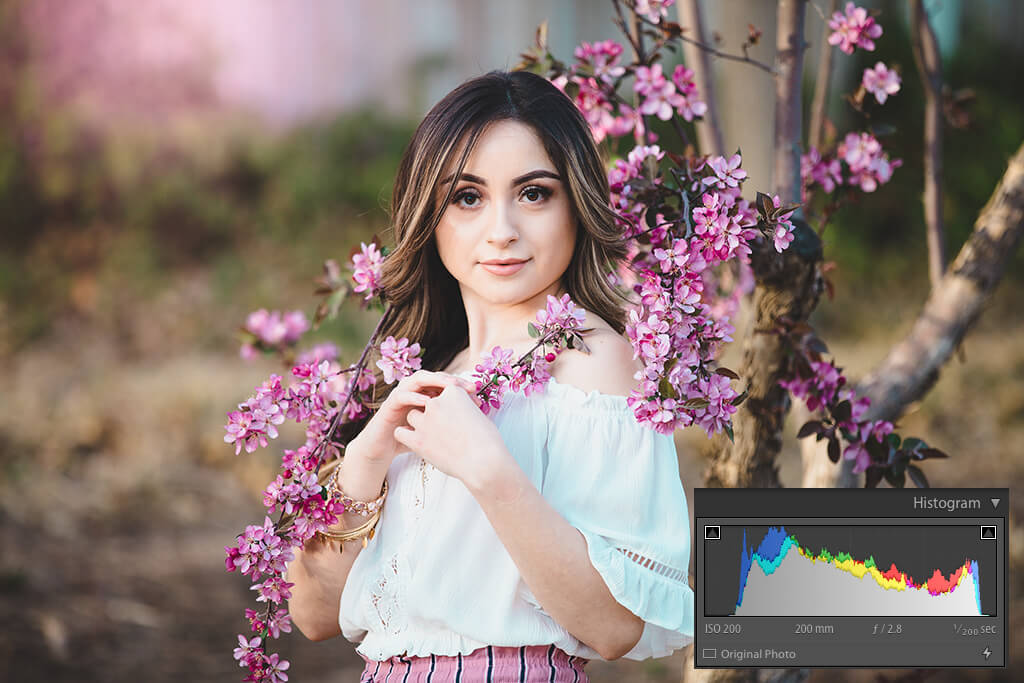
AND, you might also note that when you aren't hovering over your image, you will be able to see all the metadata information for the photo.
Do you have any questions or comments about the Lightroom Histogram? Leave us a comment below - we would LOVE to hear from you! And PLEASE SHARE this post using the social sharing buttons (we really appreciate it)!


Comments